Historical Price Data — Understand Where Prices Have Been to Know Where They Are Going
Access up to 12 months of historical pricing data for any product across 16 countries. Three chart views, weekly breakdowns, and CSV export — all accessible via deep-link or API.
Sound familiar?
Without historical data, you cannot distinguish a temporary price drop from a permanent repositioning.
Seasonal pricing patterns are invisible unless you have been tracking prices for months or years.
Repricing strategies cannot be backtested without access to historical competitor pricing.
Price negotiations with suppliers lack leverage when you cannot show long-term market trends.
Competitor analysis based on a single snapshot misses the bigger strategic picture.

Get started in minutes
Look Up Any Product
Enter an EAN/GTIN and select a country. The Price History tool retrieves historical trend data instantly — no scheduler setup required.
Explore Three Chart Views
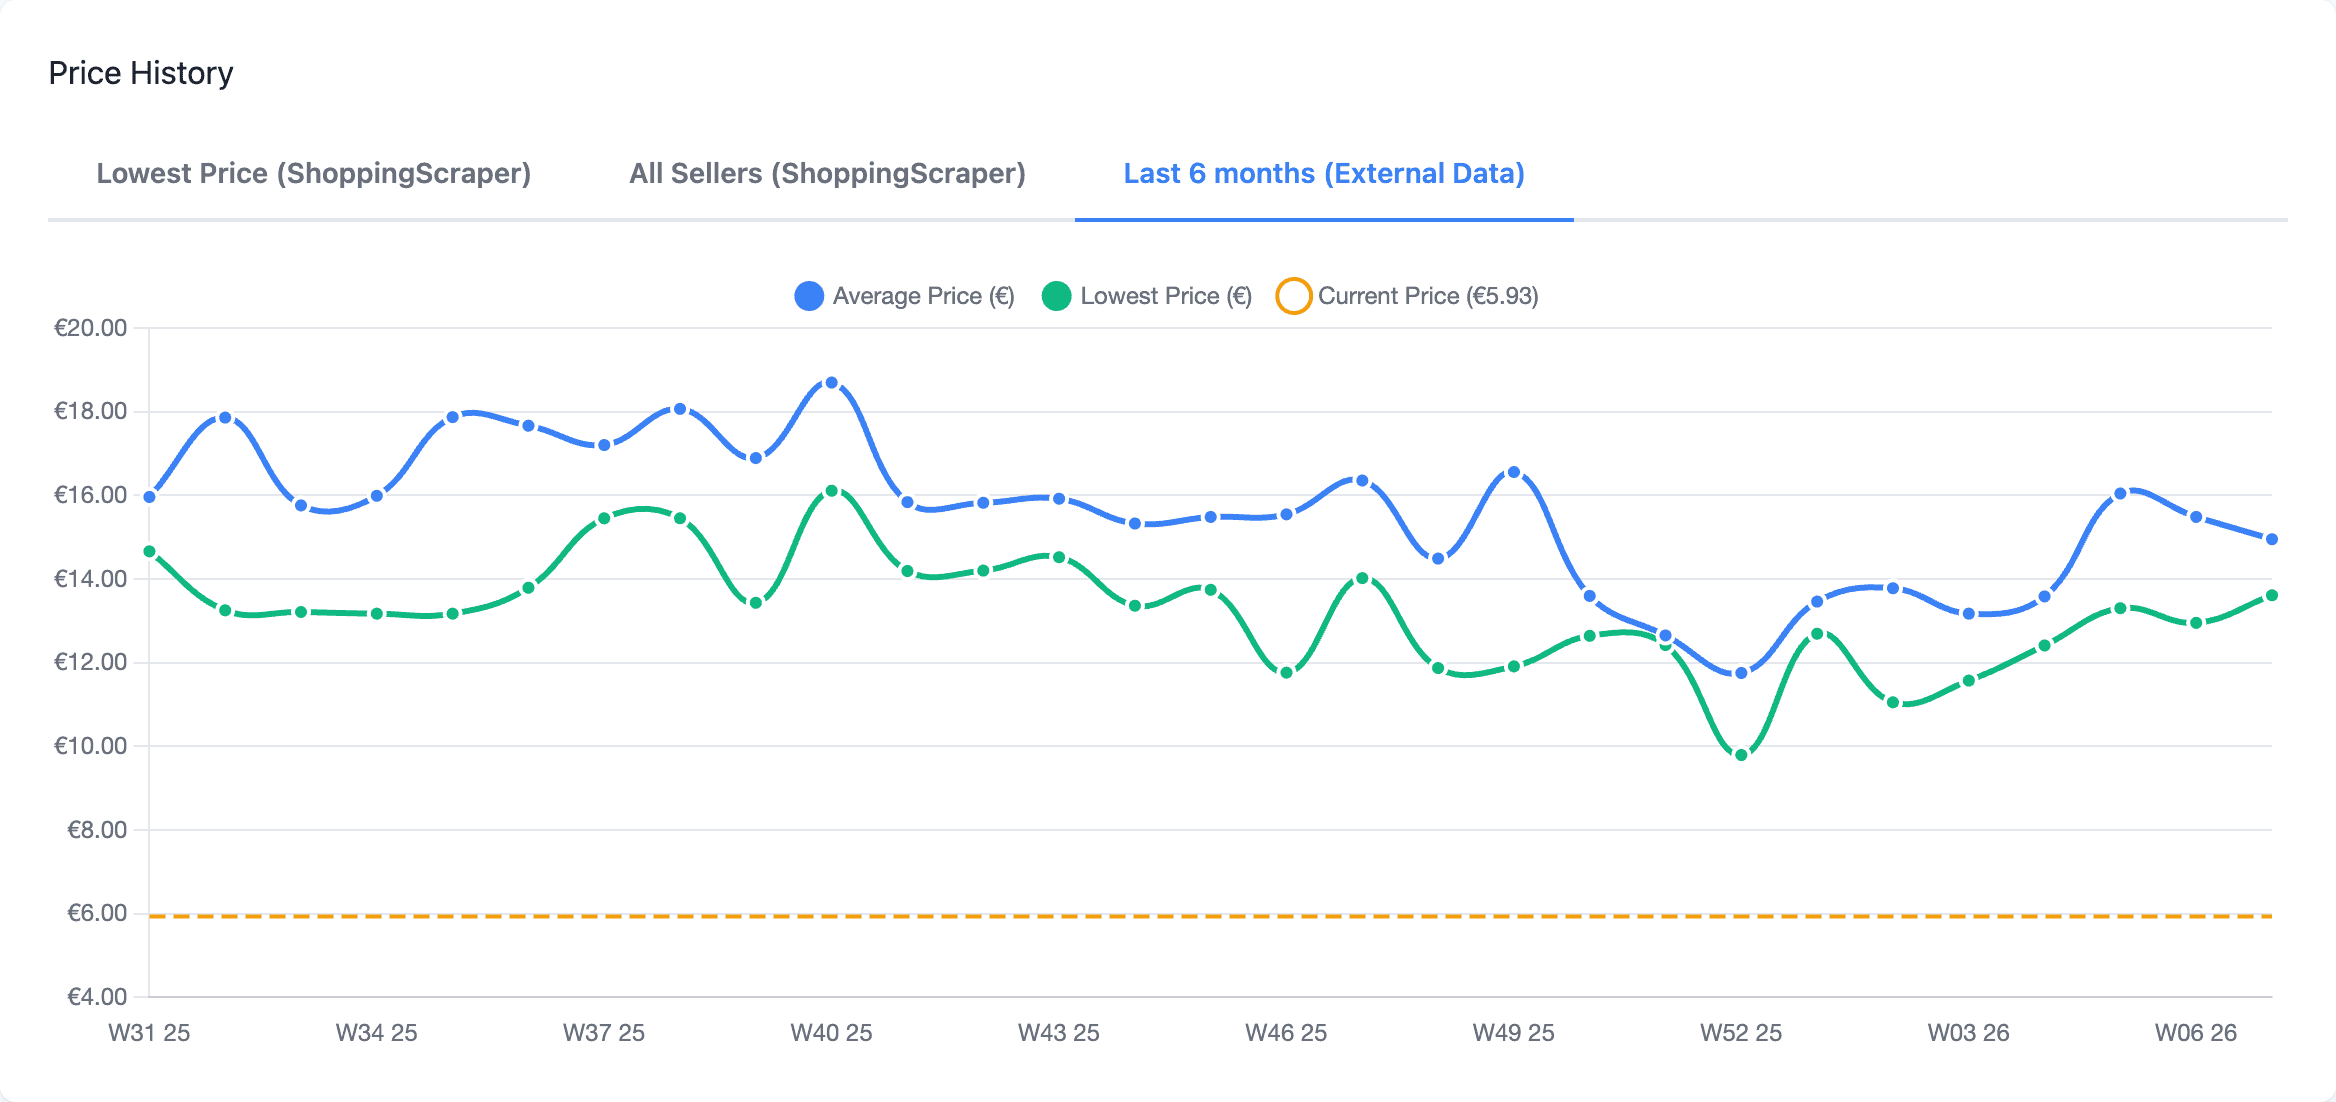
Switch between Lowest Price (cheapest trend), All Sellers (every merchant on one graph), and Last 6 Months (external historical data with average and low lines).
Analyze and Export
Review weekly data tables with dates, average/low prices, and week-over-week changes. Download as CSV or deep-link to the API Playground for the same EAN.
Everything you need
Up to 12 Months of Price Data
Access up to 12 months of historical pricing data — long enough to capture seasonal cycles, promotional patterns, and year-over-year trends.
Three Chart Modes
Lowest Price shows the cheapest trend, All Sellers overlays every merchant on one graph, and Last 6 Months shows external historical averages with low-price benchmarks.
Weekly Data Tables
Full breakdown by week showing dates, average and low prices, and week-over-week change percentages — ideal for spreadsheet analysis.
Stats Dashboard
At-a-glance cards showing current average, lowest, highest prices, period average, and price change percentage.
CSV Export
Download the complete price history dataset for any product as CSV — ready for BI tools, pivot tables, or custom analysis.
16-Country Coverage
Track pricing across 16 countries including the Netherlands, Germany, France, UK, US, and more. Switch countries instantly.
Deep-Link Support
Share or bookmark specific product histories with deep-link URLs like /price-history?ean=8710447461730&country=nl — perfect for team collaboration.
API Access to Historical Data
Query historical prices programmatically for backtesting, modeling, and custom analytics via the REST API.
Why Historical Data Beats Real-Time Snapshots
A real-time price check tells you where the market is right now. Historical data tells you where it has been, how it got there, and where it is likely to go next. With 12 months of pricing history, you can identify the competitors who discount aggressively during sales events, the brands that gradually increase prices quarter over quarter, and the sellers who consistently undercut MAP.
- Predict competitor behavior based on historical patterns
- Time your promotions to coincide with (or avoid) competitor sales
- Validate pricing strategies with data instead of assumptions

Compare all seller offers for any product
Backtesting for Smarter Repricing
Before deploying a new repricing strategy, you want to know how it would have performed in the past. ShoppingScraper's historical data lets you simulate different pricing rules against actual market conditions from the last 12 months. This reduces risk and increases confidence in automated pricing decisions.
- Simulate rule-based repricing against historical competitor prices
- Compare projected margin and revenue under different strategies
- Identify edge cases where aggressive rules would have caused losses
Track price history over time
Better Supplier Negotiations with Market Data
Walking into a supplier meeting with 12 months of market pricing data changes the conversation. You can demonstrate how street prices have trended, where your margins are being squeezed, and what competitors are paying. Data-backed negotiations lead to better terms and stronger partnerships.
- Show market price trends to justify cost reduction requests
- Demonstrate competitive pressure with multi-seller pricing data
- Track promotion frequency and depth across the distribution channel

Live pricing statistics at a glance
Frequently Asked Questions
How far back does the price history go?+
ShoppingScraper retains up to 12 months of historical pricing data from the moment you start monitoring a product. The retention period depends on your plan.
Can I access historical data via the API?+
Yes. The REST API supports date-range queries that return all recorded price points for a product, including timestamp, price, seller, and availability status.
How granular is the data?+
Granularity depends on your monitoring frequency. If you check 4x daily, you get four data points per day. If daily, you get daily snapshots. Every price change event is captured.
Can I compare prices across sellers over time?+
Yes. The dashboard lets you overlay multiple sellers on a single chart, and the API returns data grouped by seller for easy comparison.
What export formats are available?+
CSV download, Google Sheets sync, and JSON via the REST API. All formats include the full timestamp, price, currency, seller, and availability per data point.
Does historical data count against my API quota?+
Historical data queries use your regular API credits. Each query for a product's history counts as one lookup regardless of the number of data points returned.
Can I use historical data for price prediction?+
While ShoppingScraper does not offer built-in prediction models, you can export the historical data and feed it into your own machine learning or forecasting tools.
Start building your price history today
100 free API calls to evaluate the Google Shopping data. Talk to us about volume.